Browse All

1874 Blind 1870. Statistical Atlas Chart showing the aggregate number of bl … |

1874 Deaf mutes 1870. Statistical Atlas Chart showing the aggregate number of de … |

1874 Insane 1870. Statistical Atlas Chart showing the aggregate number of in … |

1874 Idiots 1870. Statistical Atlas Chart showing the aggregate number of id … |

1943 Relative Efficiency of Primitive and Mod … World Atlas Relative Efficiency of Primitive and Mod … |

1900 Diagram: Plate XLI. Diagram Showing Rang … [Geologic Atlas, Geology Book] (Diagram) Plate XLI. Diagram Showing Ran … |

1856 Health, disease. Physical Atlas The geographical distribution of health … |

1829 Meteorological diagrams. State Atlas Meteorological diagrams. Monthly means o … |

1907 Text and Statistical Diagram: Commercial … Statistical Atlas (Text Page and Statistical Diagram) Comm … |

1907 Statistical Diagram: Wealth and Populati … Statistical Atlas (Statistical Diagram) Wealth and Populat … |

1907 Statistical Diagram: Comparative Imports … Statistical Atlas (Statistical Diagram) Comparative Import … |

1907 Statistical Diagram: Aspects of British … Statistical Atlas (Statistical Diagram) Aspects of British … |

1907 Statistical Diagram: Aspects of British … Statistical Atlas (Statistical Diagram) Aspects of British … |

1907 Statistical Diagram: International Shipp … Statistical Atlas (Statistical Diagram) International Ship … |

1907 Statistical Diagram: International Railw … Statistical Atlas (Statistical Diagram) International Rail … |

1907 British Isles - Industrial. Agricultural … Statistical Atlas British Isles - Industrial. Agricultural … |

1907 Statistical Diagram: Import and Export T … Statistical Atlas (Statistical Diagram) Import and Export … |

1907 Text and Statistical Diagram: Wheat. Statistical Atlas (Text Page and Statistical Diagram) Whea … |

1907 Text and Statistical Diagram: Wheat. Statistical Atlas (Text Page and Statistical Diagram) Whea … |

1907 Text and Statistical Diagram: Meat. Statistical Atlas (Text Page and Statistical Diagram) Meat … |

1907 Text and Statistical Diagram: Meat and C … Statistical Atlas (Text Page and Statistical Diagram) Meat … |

1907 Text and Statistical Diagram: Rice. Rye. Statistical Atlas (Text Page and Statistical Diagram) Rice … |

1907 Text and Statistical Diagram: Barley. Statistical Atlas (Text Page and Statistical Diagram) Barl … |

1907 Text and Statistical Diagram: Sugar. Statistical Atlas (Text Page and Statistical Diagram) Suga … |

1907 Text and Statistical Diagram: Sugar. Statistical Atlas (Text Page and Statistical Diagram) Suga … |

1907 Text and Statistical Diagram: Tea. Statistical Atlas (Text Page and Statistical Diagram) Tea. |

1907 Text and Statistical Diagram: Tea. Statistical Atlas (Text Page and Statistical Diagram) Tea. |

1907 Text and Statistical Diagram: Coffee. Statistical Atlas (Text Page and Statistical Diagram) Coff … |

1907 Text and Statistical Diagram: Coffee. Statistical Atlas (Text Page and Statistical Diagram) Coff … |

1907 Text and Statistical Diagram: Wine. Statistical Atlas (Text Page and Statistical Diagram) Wine … |

1907 Text and Statistical Diagram: Wine. Statistical Atlas (Text Page and Statistical Diagram) Wine … |

1907 Text and Statistical Diagram: Beer. Spir … Statistical Atlas (Text Page and Statistical Diagram) Beer … |

1907 Text and Statistical Diagram: Cocoa. Statistical Atlas (Text Page and Statistical Diagram) Coco … |
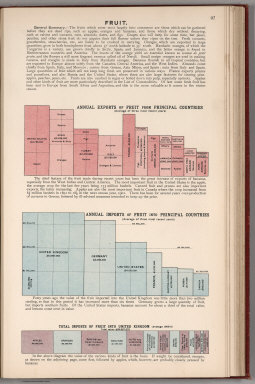
1907 Text and Statistical Diagram: Fruit. Statistical Atlas (Text Page and Statistical Diagram) Frui … |

1907 Text and Statistical Diagram: Apples. Or … Statistical Atlas (Text Page and Statistical Diagram) Appl … |

1907 Text and Statistical Diagram: Dairy. Statistical Atlas (Text Page and Statistical Diagram) Dair … |

1852 Distribution of Man According to the Pre … Physical Atlas Moral & Statistical Chart, Showing the D … |

1883 Statistical Diagram: Comparative Diagram … World Atlas (Statistical Diagram) Comparative Diagra … |

1883 Statistical Diagram: Diagram of the Annu … World Atlas (Statistical Diagram) Diagram Showing th … |

1883 Statistical Diagram: Diagram of Comparat … World Atlas (Statistical Diagram) Diagram Showing th … |

1883 Statistical Diagram: Comparative Miles o … World Atlas (Statistical Diagram) Diagram Showing th … |

1883 Statistical Diagram: Comparative Nationa … World Atlas (Statistical Diagram) Diagram Showing th … |

1884 Statistical Diagram: Chart Exhibiting th … National Atlas (Statistical Diagram) Chart Exhibiting t … |

1919 Statistical Diagram: World War I (German … Military Atlas (Statistical Diagram) Nr. 226. Der Woech … |

1770 Eaux de la Seine. Physical Atlas Profils represents la crue et la diminut … |

1895 Statistics U.S., N.Y. State Atlas Statistics, United States. Statistics, N … |

1979 Foreword (continued). Glossary. Chapter … State Atlas Foreword (continued). Glossary. Chapter … |

1979 Chapter 2. The Natural Endowment (contin … State Atlas Chapter 2. The Natural Endowment (contin … |

1979 Annual Runoff and Seasonality. Chapter 2 … State Atlas Annual Runoff and Seasonality. Chapter 2 … |

1979 Growing Season Evapotranspiration. Chapt … State Atlas Growing Season Evapotranspiration. Chapt … |